iCrop Performance brings + management and + technology to the farm, offering new perspectives to common agricultural challenges linked to climate and rainfall. It uses satellite equipment, real-time data analysis and precise forecasts to assist in the effective management of crops.
Thinking of raising the technological level and control of your farm?
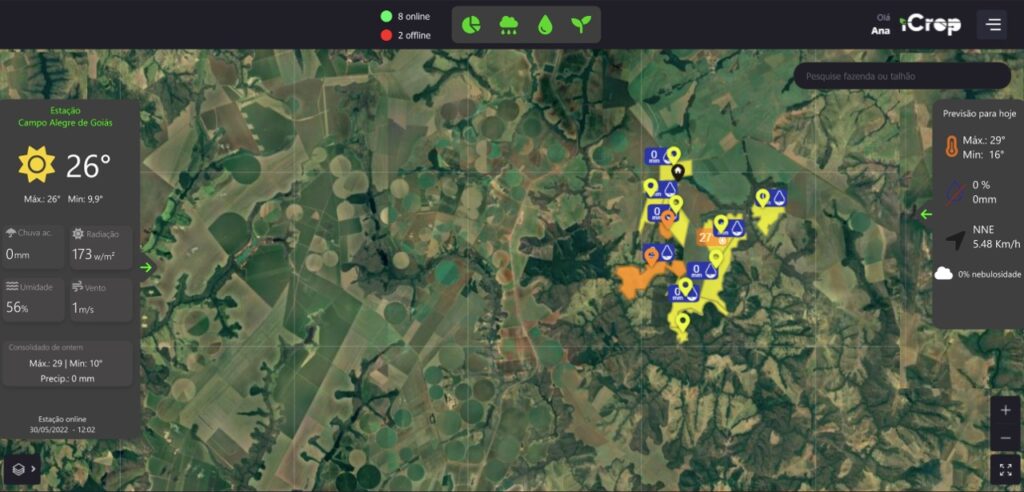
Would you like to follow the rain on every farm in real time without relying on a person collecting?
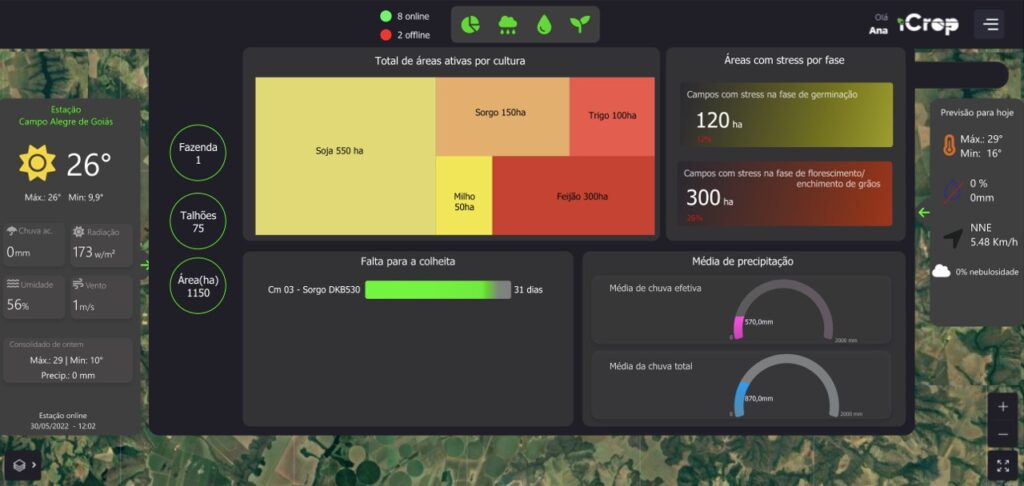
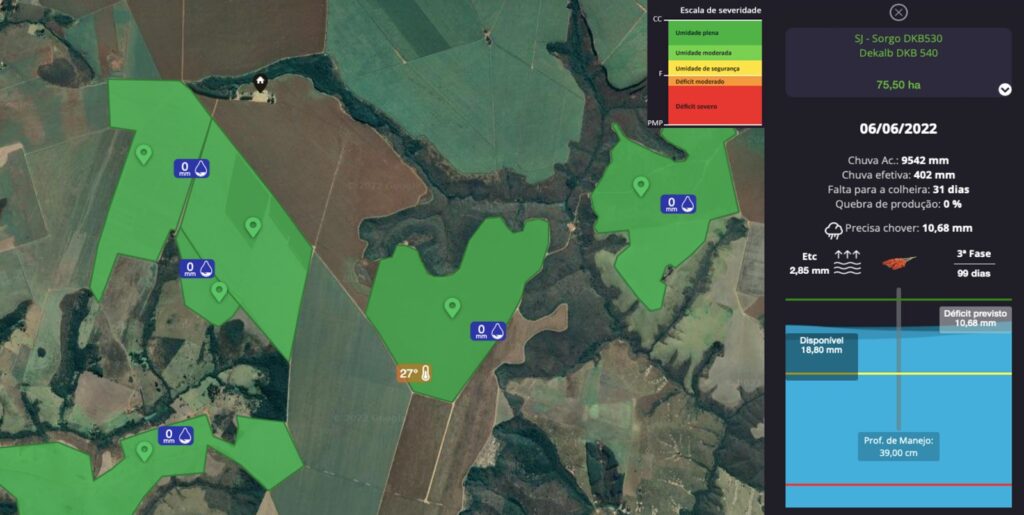
Would you like to understand how many days of summer you would endure your crop according to the type of soil on each bed of the farm?
Would it be important to be able to monitor the agroclimate conditions of crops remotely and in real time?
What about the possibility of identifying the level of water stress in these crops?
Is it important to know about what the rain forecast for the next few days?
Have you ever wondered if farming productivity was affected by lack of water?
We bring with iCrop Performance the management of the impact of water on crops installed in non-irrigated areas. The service involves high-tech coupled solutions such as:
Higher visibility and monitoring of the farm with increased technological level
Real-time climate monitoring with forecast
Weekly weather bulletins with warnings
Real-time rain collection with satellite communication
Water balancing of heels with iCrop know-how
Operational efficiency gains and workforce optimization
Security in decision-making with cost reduction
Deploy custom management dashboards and reports
Remote monitoring center and customer support.
NDVI images
Sensing integrated with the iCrop Know how platform, with more than 3.6 million hectares monitored, generates reliable, up-to-date and organized information all the time for monitoring and analysis of crop potential.